查询cpu的过程
- 查看应用的pid,我的应用名称是以dlap开头
jps的命令参数如下,jps [options] [hostid]- -q 不输出类名、Jar名和传入main方法的参数
- -m 输出传入main方法的参数
- -l 输出main类或Jar的全限名
- -v 输出传入JVM的参数
1
2
3
4
5
jps -m -l
或者
ps -ef | grep dlap | grep -v grep
或者
ps aux | grep dlap | grep -v greppid
- 查看应用的pid,我的应用名称是以dlap开头
- 查看系统资源占用信息,使用
top查一下当前进程pid占用较高的cpu线程1
2
3
4
5top -Hp pid
// 也可以用以下两个命令
ps -Lfp pid
// 或者
ps -mp pid -o THREAD, tid, time | sort -rn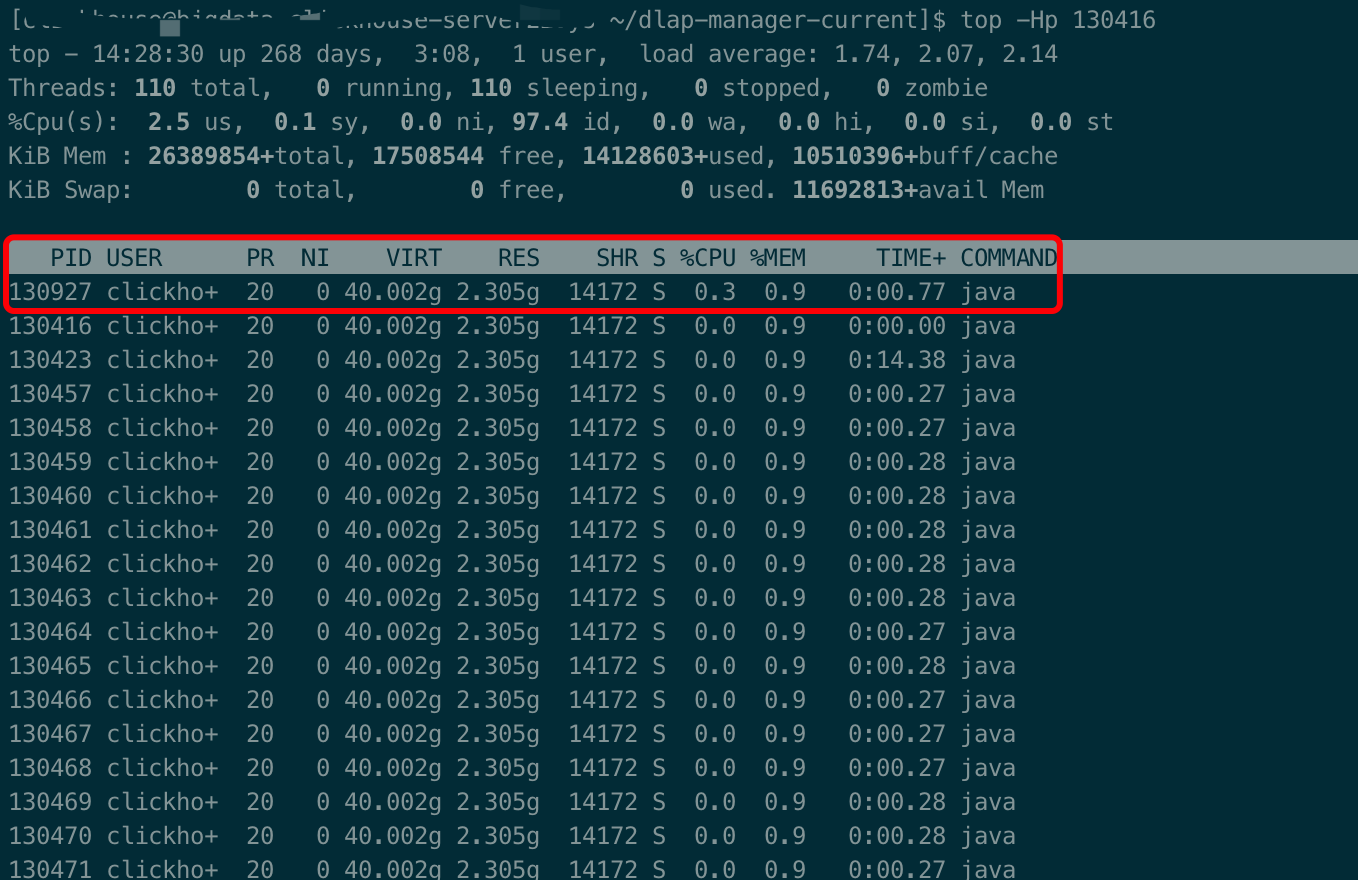
- 查看系统资源占用信息,使用
- 将需要的线程
ID转换为16进制格式,可以使用printf "%x\n" tid命令1
printf "%x\n" tid

- 将需要的线程
- 打印线程堆栈信息,可以使用命令
jstack pid | grep tid,注意这里的tid是线程ID的16进制值1
jstack pid | grep tid

- 打印线程堆栈信息,可以使用命令
jmap命令介绍
jmap可以导出堆内容,然后使用jhat进行分析,语法如下
2
3
4
5
6
7
8
jmap - Prints shared object memory maps or heap memory details for a process, core file, or remote debug server. This command is
experimental and unsupported.
SYNOPSIS
jmap [ options ] pid
jmap [ options ] executable core
jmap [ options ] [ pid ] server-id@ ] remote-hostname-or-IP
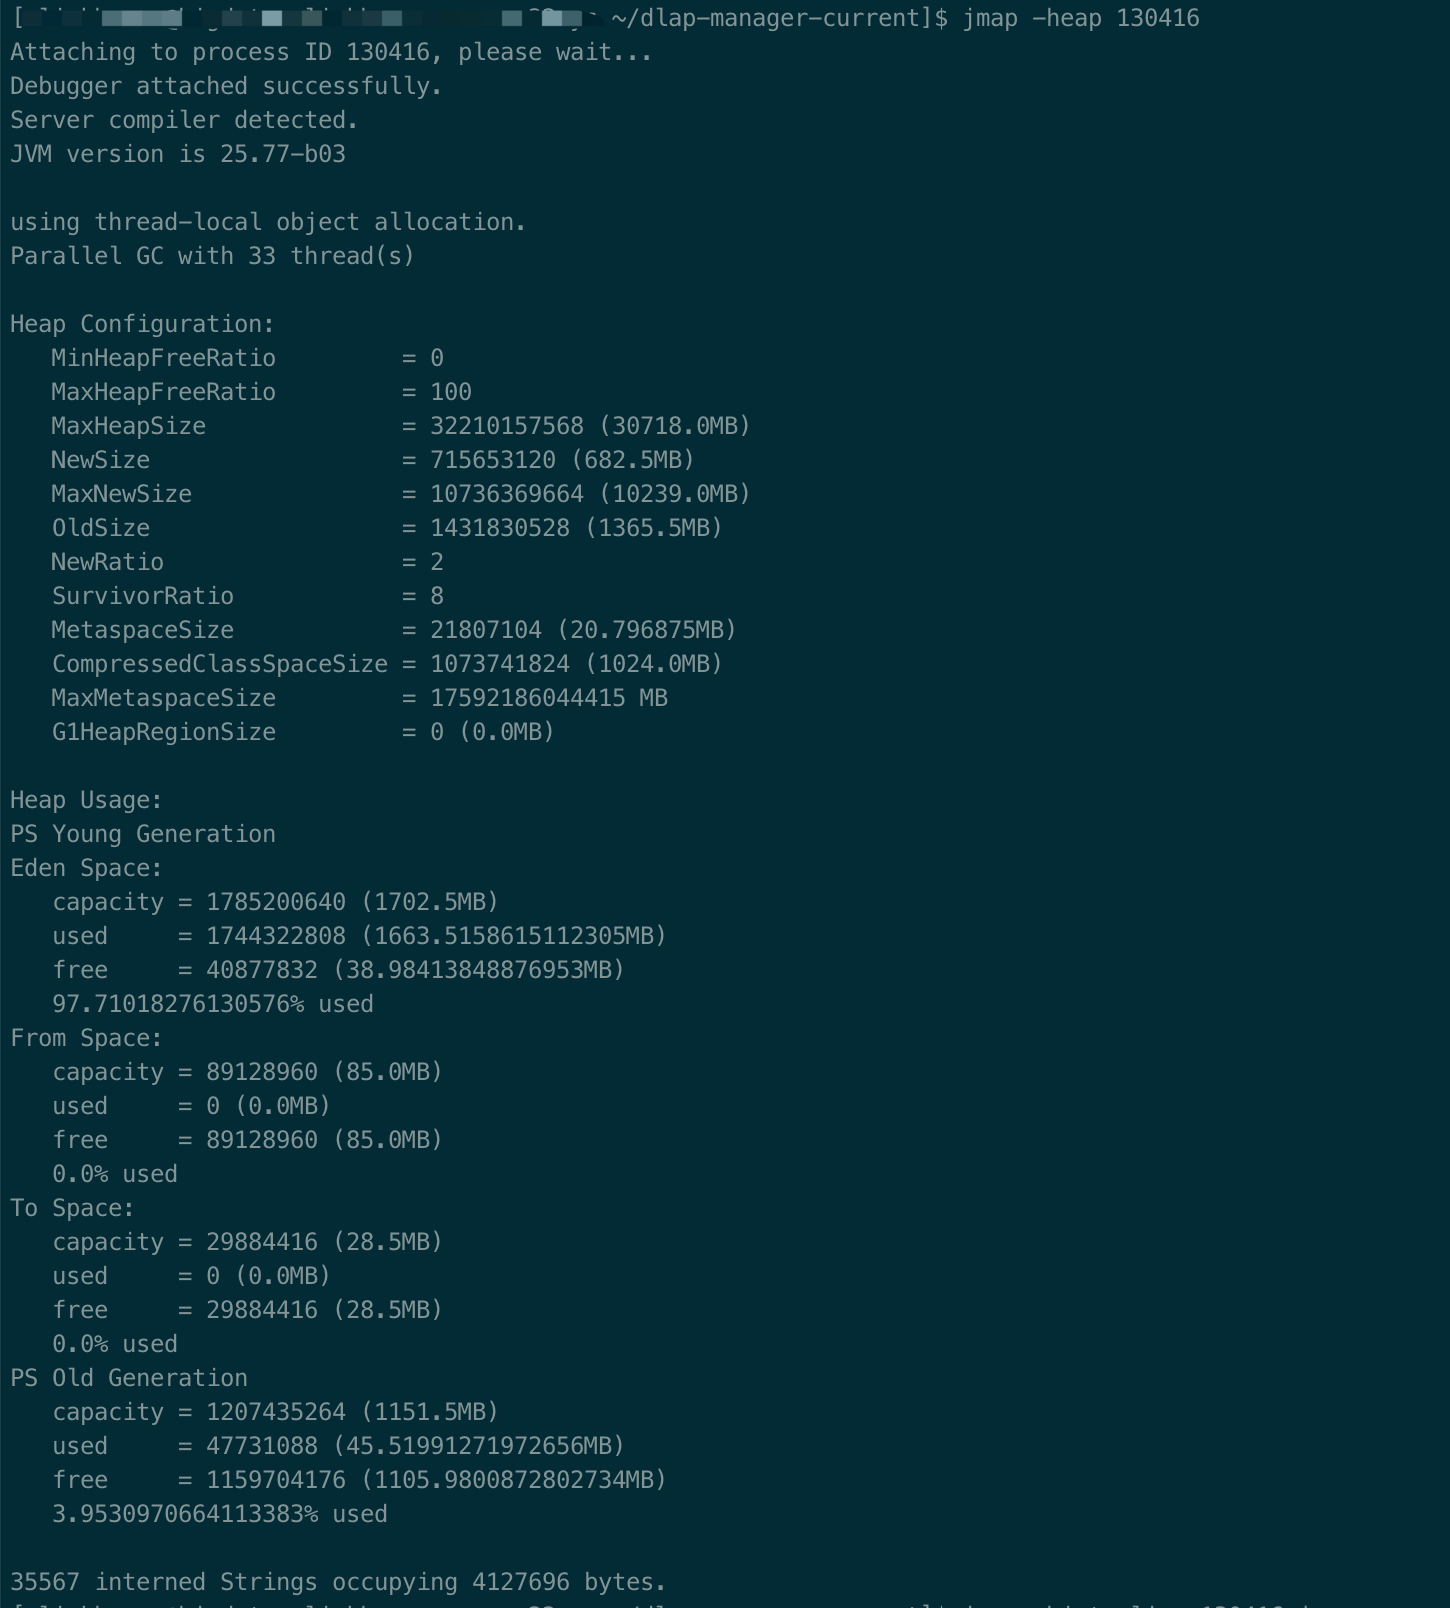
- 根据pid查看堆内存使用情况,包括使用的GC算法、堆配置参数和各代中堆内存使用情况
- 根据pid查看堆内存中的对象数目、大小统计直方图,如果带上live则只统计活对象
1
jmap -histo:live pid | more
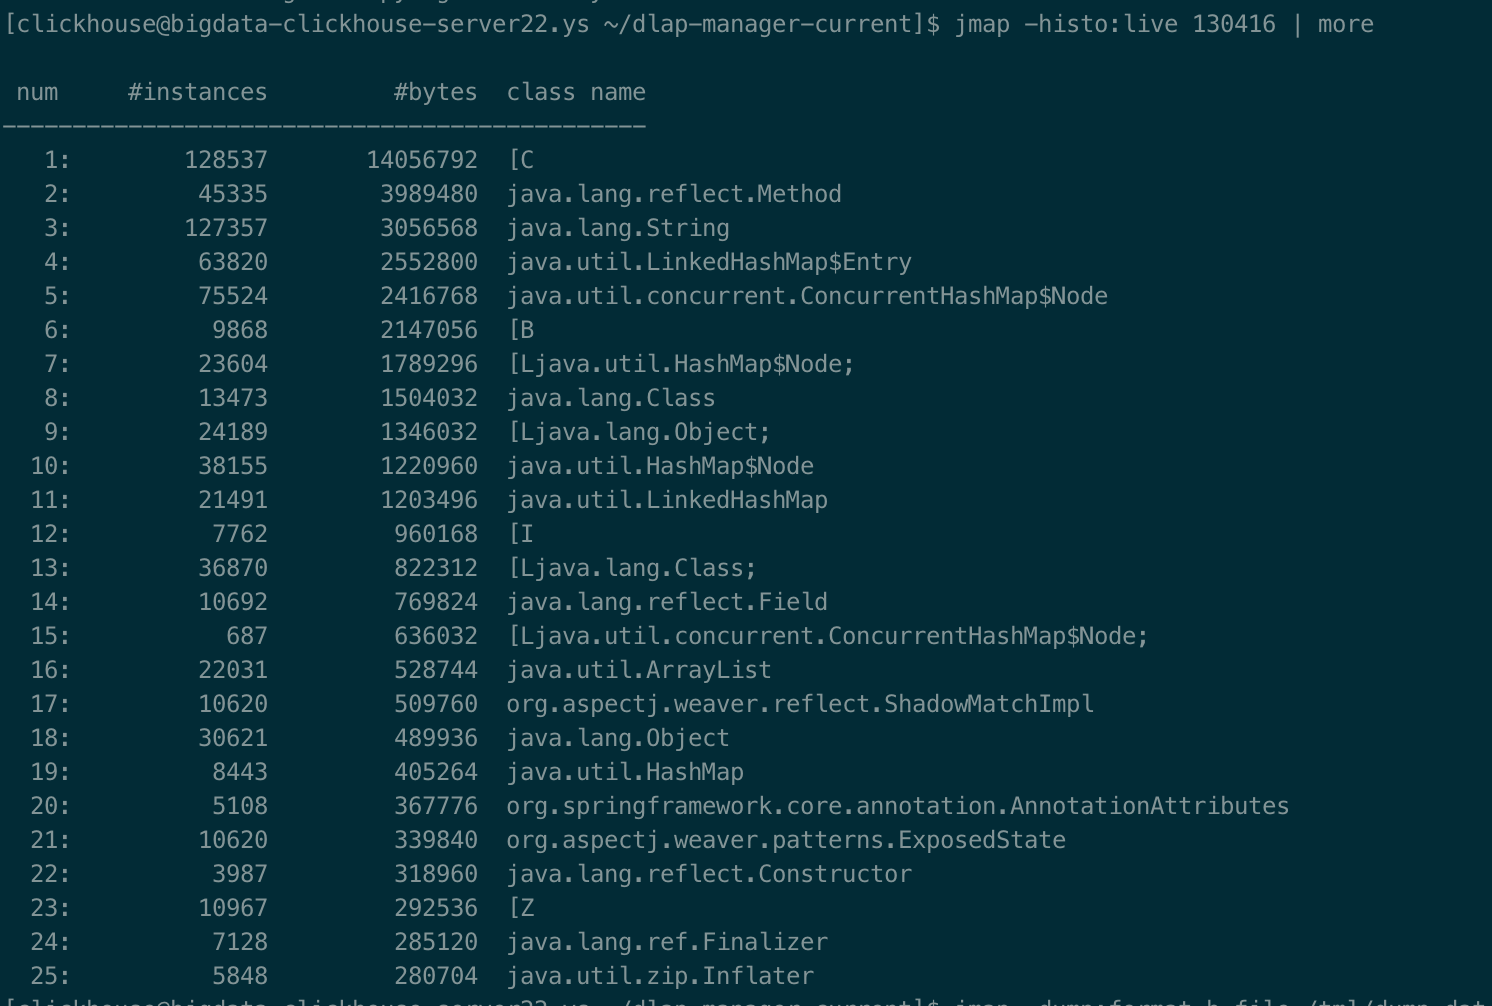
class name是对象类型,说明如下
1
2
3
4
5
6
7
8
9B byte
C char
D double
F float
I int
J long
Z boolean
[ 数组,如[I表示int[]
[L+类名 其他对象 - 用jmap把进程内存使用情况dump到文件中,再用jhat分析查看
1
jmap -dump:format=b,file=dumpFileName pid

- 用jhat查看
1
2
3
jhat -port 9998 /tmp/dump.dat
// 注意如果Dump文件太大,可能需要加上-J-Xmx512m这种参数指定最大堆内存
jhat -J-Xmx512m -port 9998 /tmp/dump.dat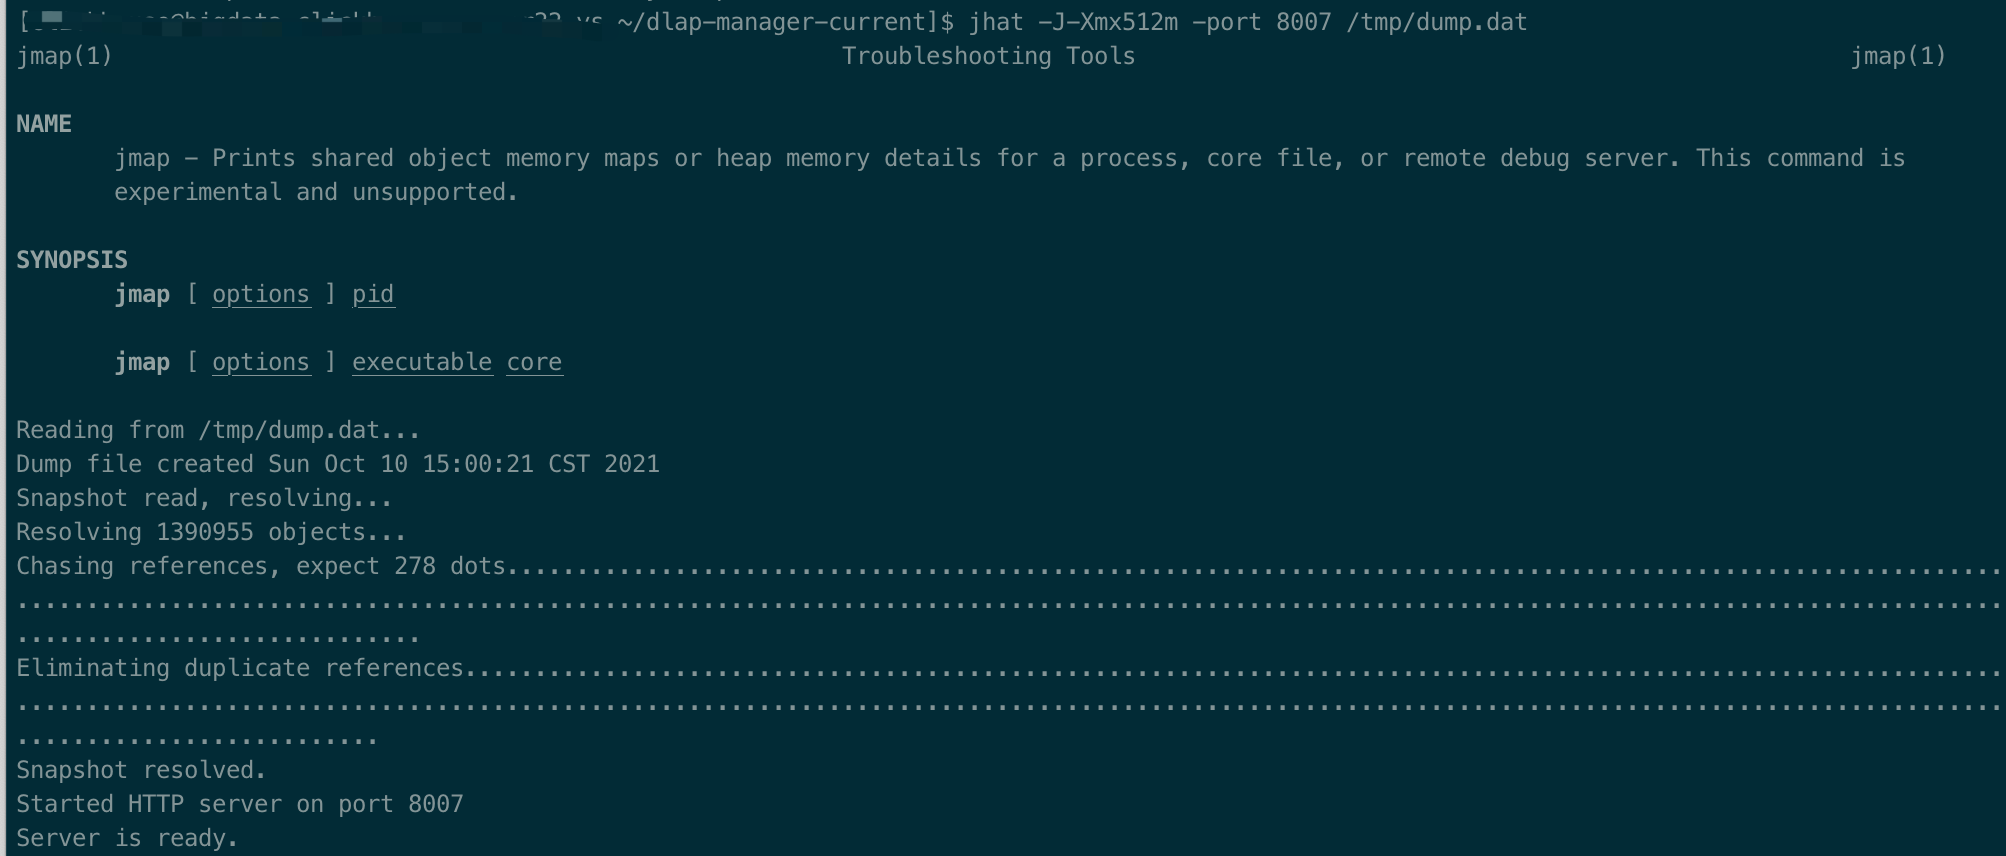
然后用浏览器打开,http://ip:9998
jstat(JVM统计监测工具)
1 | NAME |
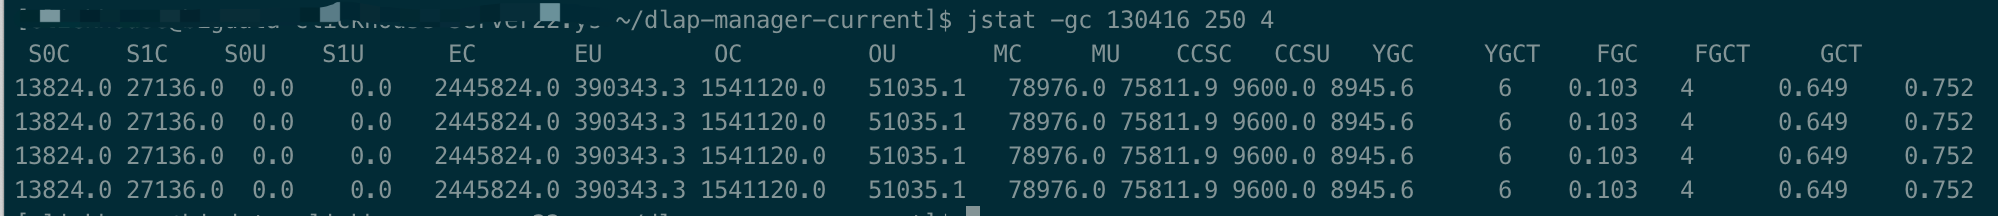
- 根据pid 间隔250ms 采样条数4 输出GC信息
1
jstat -gc pid 250 4
jvm 堆内容布局

1
2
堆内存 = 年轻代 + 年老代 + 永久代
年轻代 = Eden区 + 两个Survivor区(From和To)各列含义
1
2
3
4
5
6
7
S0C、S1C、S0U、S1U:Survivor 0/1区容量(Capacity)和使用量(Used)
EC、EU:Eden区容量和使用量
OC、OU:年老代容量和使用量
PC、PU:永久代容量和使用量
YGC、YGT:年轻代GC次数和GC耗时
FGC、FGCT:Full GC次数和Full GC耗时
GCT:GC总耗时
hprof用法
hprof 能展现cpu使用率,堆内存使用情况,语法格式如下
2
3
java -Xrunprof[:options] ToBeProfiledClass
javac -J-agentlib:hprof[=options] ToBeProfiledClass
完整的命令格式
2
3
4
5
6
7
8
9
10
11
12
13
14
15
16
17
--------------------- ----------- -------
heap=dump|sites|all heap profiling all
cpu=samples|times|old CPU usage off
monitor=y|n monitor contention n
format=a|b text(txt) or binary output a
file=<file> write data to file java.hprof[.txt]
net=<host>:<port> send data over a socket off
depth=<size> stack trace depth 4
interval=<ms> sample interval in ms 10
cutoff=<value> output cutoff point 0.0001
lineno=y|n line number in traces? y
thread=y|n thread in traces? n
doe=y|n dump on exit? y
msa=y|n Solaris micro state accounting n
force=y|n force output to <file> y
verbose=y|n print messages about dumps y
- 每隔20毫秒采样CPU消耗信息,堆栈深度为3
- 获取CPU消耗信息,能够细到每个方法调用的开始和结束,它的实现使用了字节码注入技术(BCI)
1 | javac -J-agentlib:hprof=heap=sites Hello.java |
1 | javac -J-agentlib:hprof=heap=dump Hello.java |
注意在JVM启动参数中加入-Xrunprof:heap=sites参数可以生成CPU/Heap Profile文件,但对JVM性能影响非常大,不建议在线上服务器环境使用
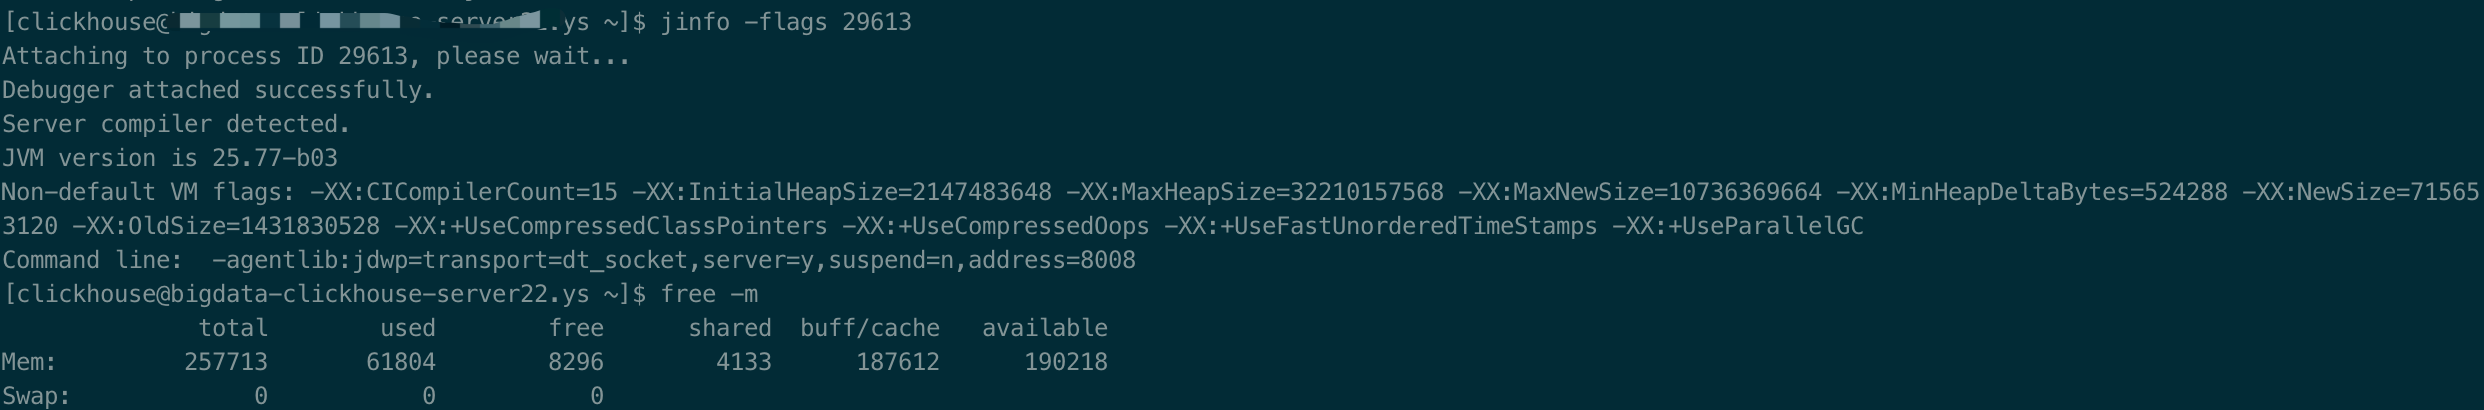
jinfo查看jvm启动参数
1 | // 看出所有参数 |
- 开启/关闭某个jvm参数
使用jinnfo可以在不重启虚拟机的情况下,动态修改jvm的参数,这个方法在生产环境尤其特别有用
1
2
3// jinfo -flag [+|-]name pid
jinfo -flag +PrintGC pid
jinfo -flag -PrintGC pid - 修改某个JVM进程的值
1
2
// jinfo -flag name=value pid
jinfo -flag InitialHeapSize=64g pid注意并不是所有参数都支持动态修改
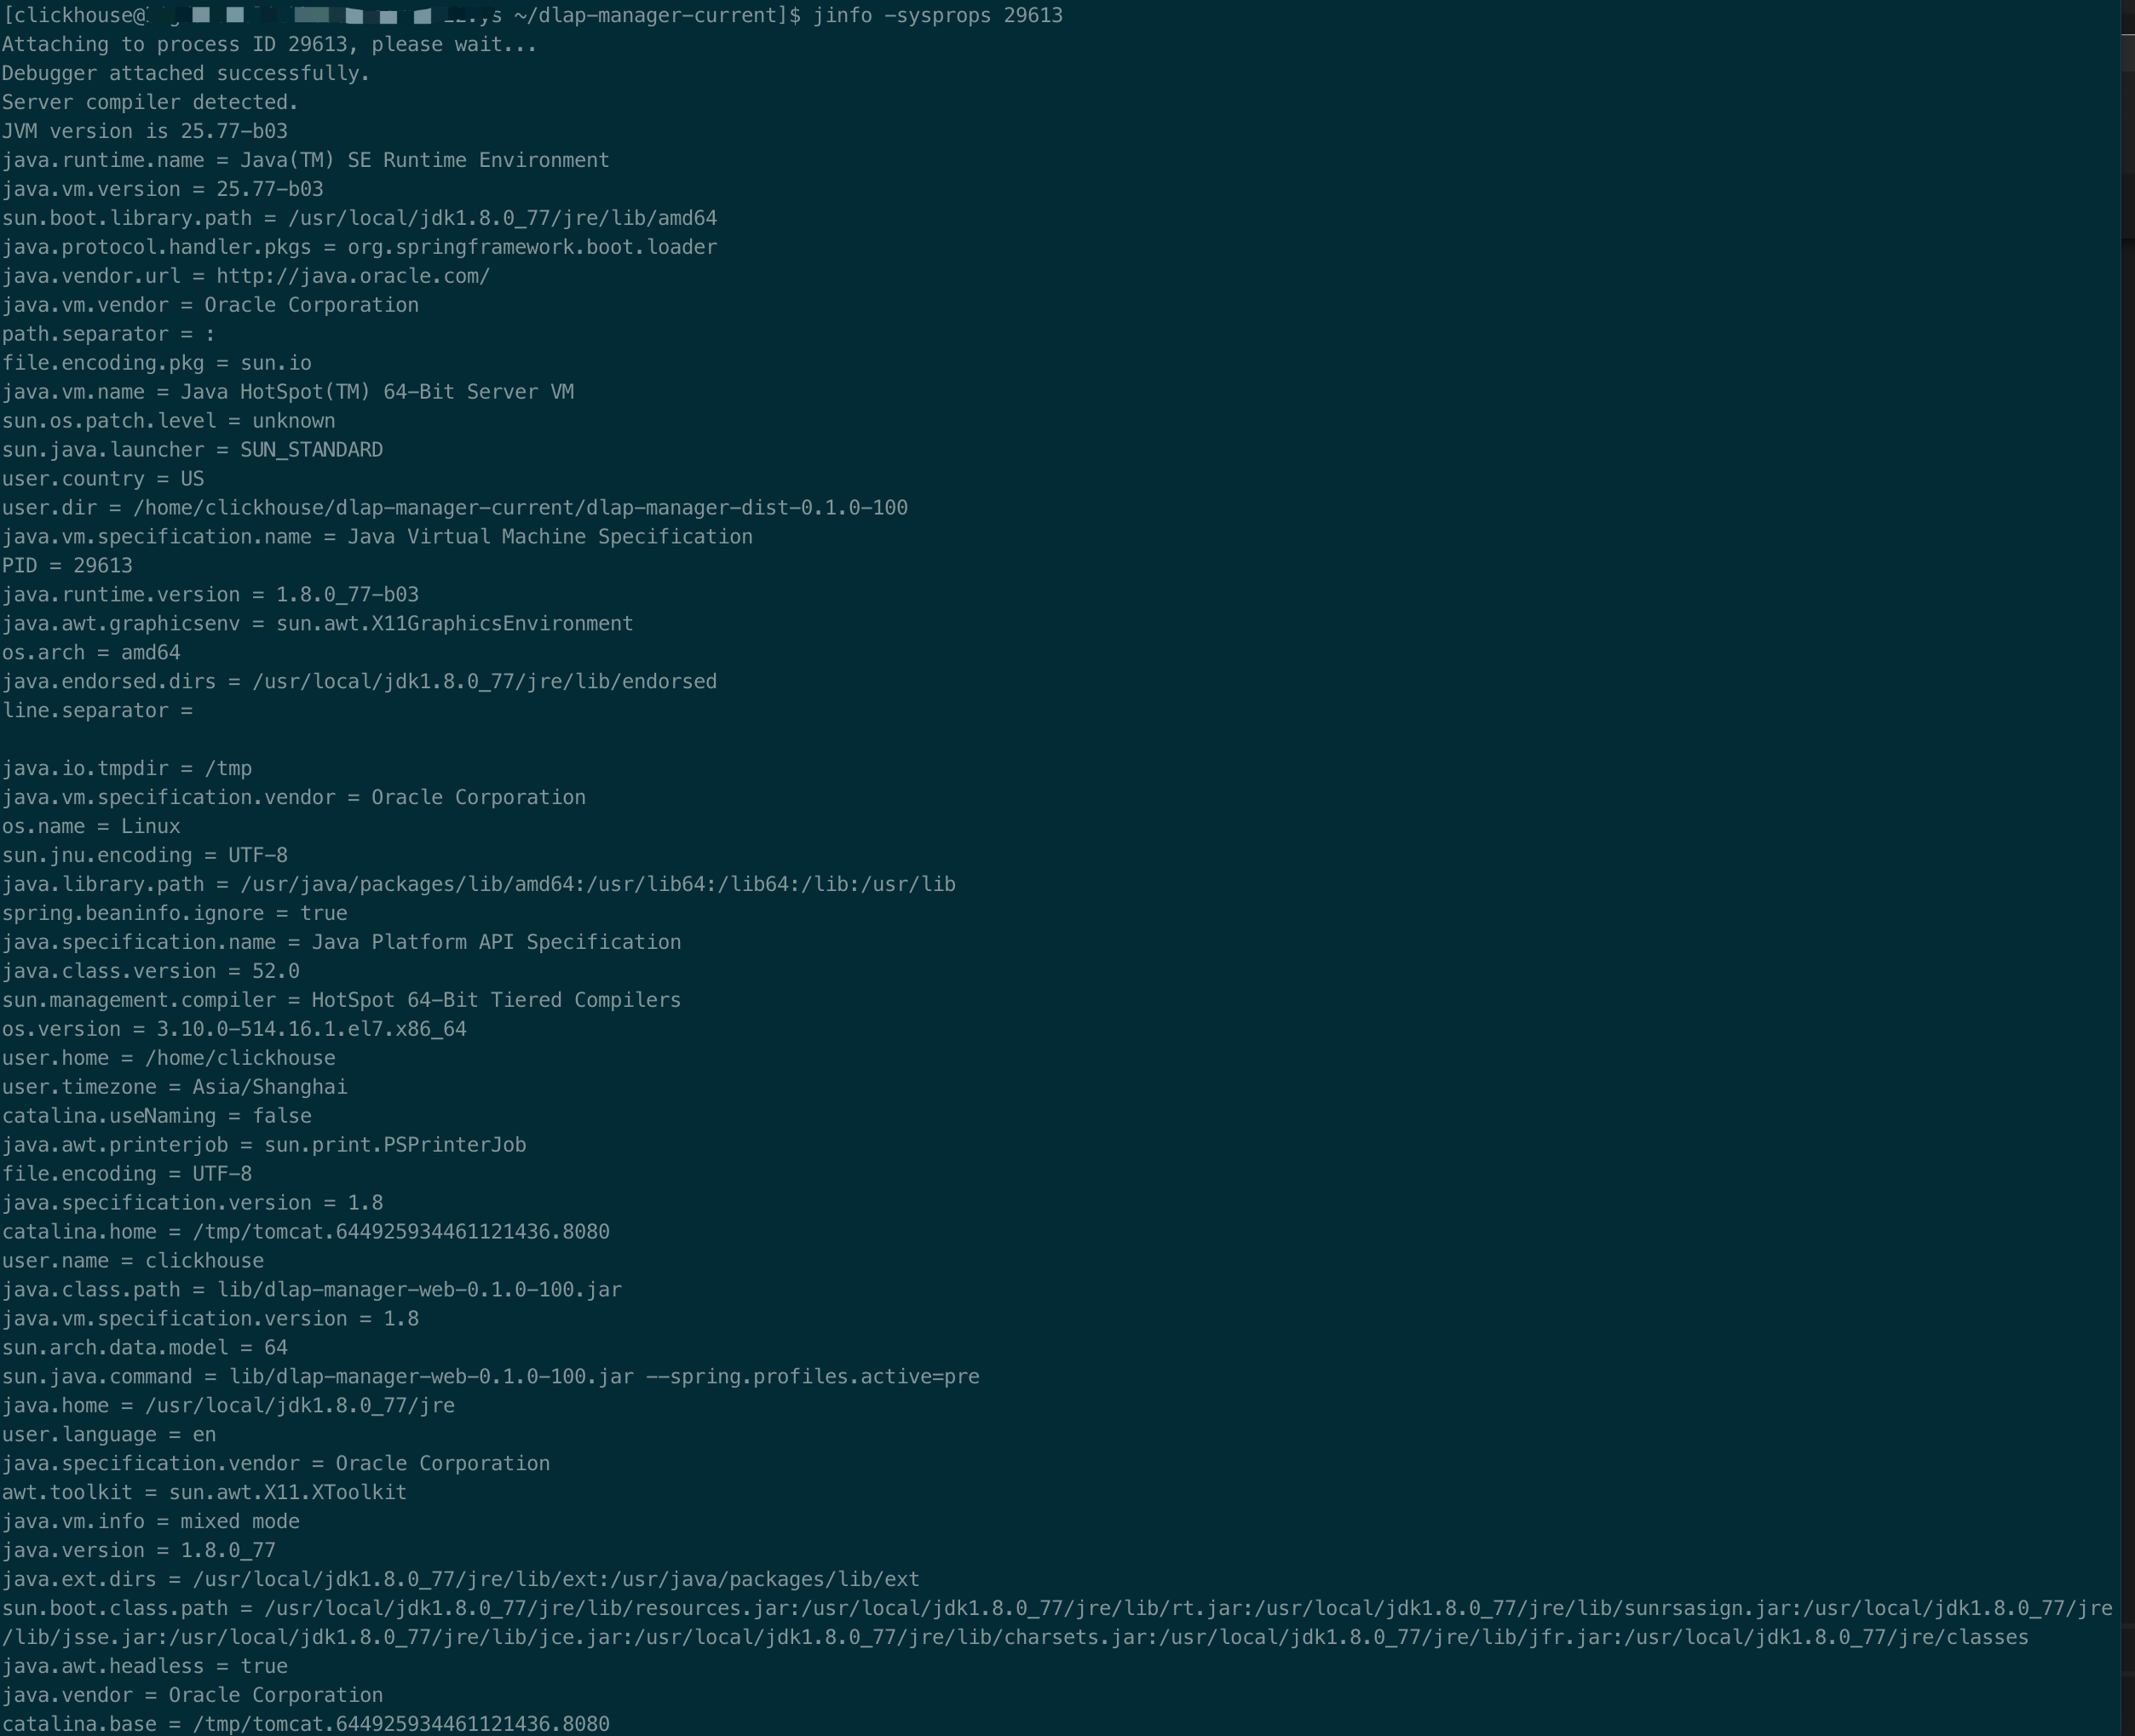
- 查看当前jvm进程所有的系统属性
1
jinfo -sysprops pid
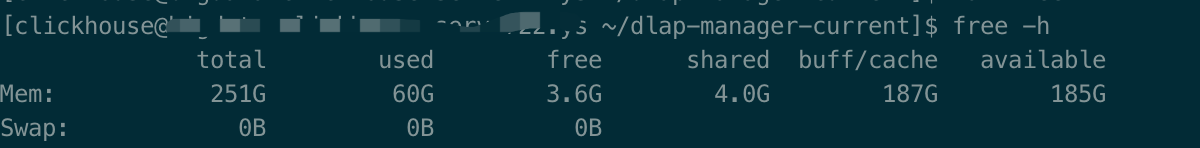
free命令查看机器物理内存
1 | OPTIONS |